
2021年07月25日
Bollinger Bands is a technical analysis tool defined by trend lines drawn at two standard deviations, positive and negative, from the moving average of the market price. The combination of parameters can be adjusted to the user’s preference.
Bollinger Bands were developed by renowned technical trader John Bollinger to increase the probability that an investor will properly identify an asset as “oversold” or “overbought.

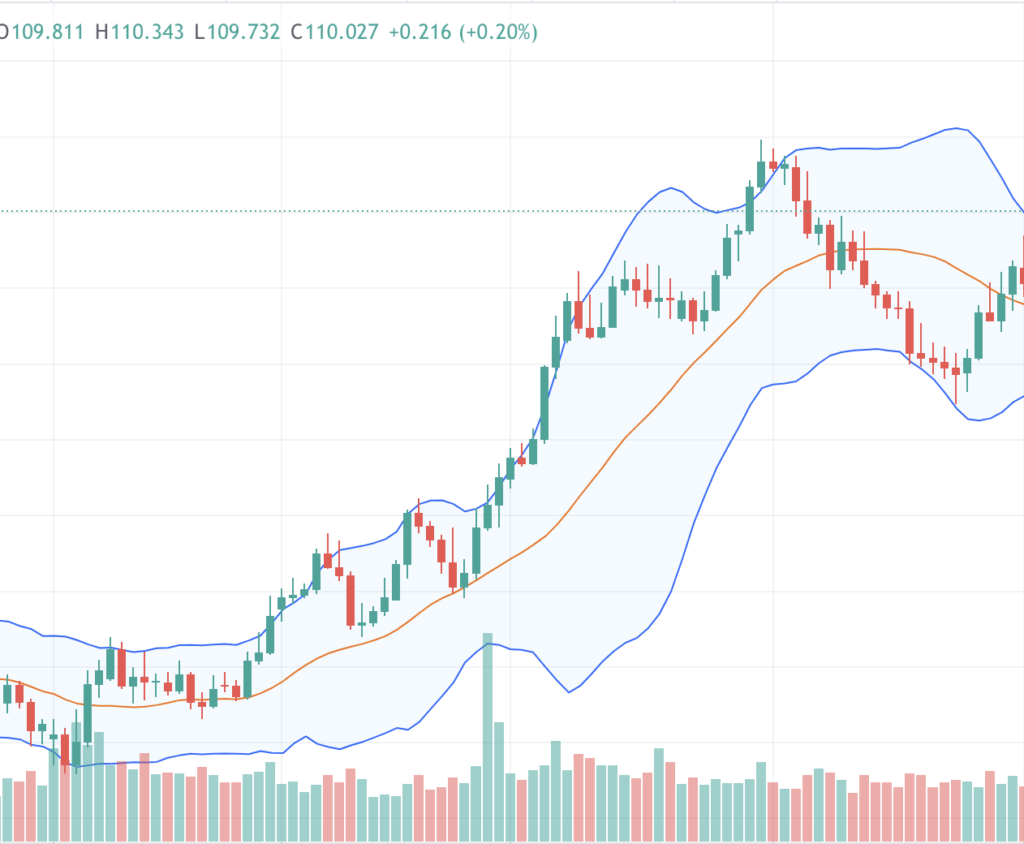
The above image shows the daily Bollinger Bands for USDJPY
As can be seen from the above image, the price is rising after touching the lower side of the Bollinger Band, but it continues to rise without being reversed even though it touched the upper side. This is the biggest weakness of the Bollinger Band. This will be explained later.
Find the standard deviation of the price for a given period
Upper band: Simple moving average + n standard deviation (σ
) Lower band: Simple moving average – n standard deviation (σ)
n is generally 1, 2, or 3.
Squeeze

Squeeze is the central concept of Bollinger Bands. A squeeze is when the bands get close together and squeeze the moving average. The area circled in orange in the image above is the squeeze.
Squeezes indicate periods of low volatility and are considered by traders to be indicative of future volatility increases and potential trading opportunities. Conversely, when the bands move apart, it is called a BOJ. This is the area framed in blue in the image above.
Volatility is more likely to decrease and the trade is more likely to close. However, these conditions are not trading signals. The bands do not indicate when a change will occur or in which direction prices will move.
Breakouts.
Approximately 90% of price changes occur between two bands. A breakout above or below a band is a major event. Breakouts are not buy or sell signals. The mistake many people make is to think that price hitting or crossing one of the bands is a buy or sell signal. Breakouts are not clues to the direction or extent of future price movements.
Bollinger Bands are not a stand-alone trading system. This is the first thing to note. Bollinger Bands are simply another indicator designed to provide traders with information about price movements. John Bollinger suggests using it in conjunction with two or three other non-correlated indicators that provide more direct market signals. He also believes it is important to use indicators based on different types of data. Bollinger recommends using a combination of technical indicators such as moving average divergence (MACD), on-balance volume (volume), and relative strength index (RSI).
Therefore, it is not recommended to use Bollinger Bands alone for entry, and other technical indicators must be used in conjunction to analyze the market. Please note that this is a difficult type of technical analysis to handle.
コントラは最高のFXアプリを
目指して誠意開発を続けております。
機能の要望や、不具合などありましたらご遠慮なくヘッダーの問い合わせ、フィードバックからご連絡ください。またツイッターからでも大丈夫です!
皆様のFXトレードのお力になるFXアプリを目指しますので、これからもよろしくお願いいたします。